

- Hilbert Curve (food for the golfers)
- 21 Mar 2021 08:10:56 pm
- Last edited by mr womp womp on 22 Mar 2021 05:02:14 pm; edited 7 times in total
I made a 2D Hilbert Curve grapher.
Here is the code
Code:
EDIT: Incorporated some of the optimizations from other users.
(The inner loops are optimized for speed rather than size since they can be called thousands of times)
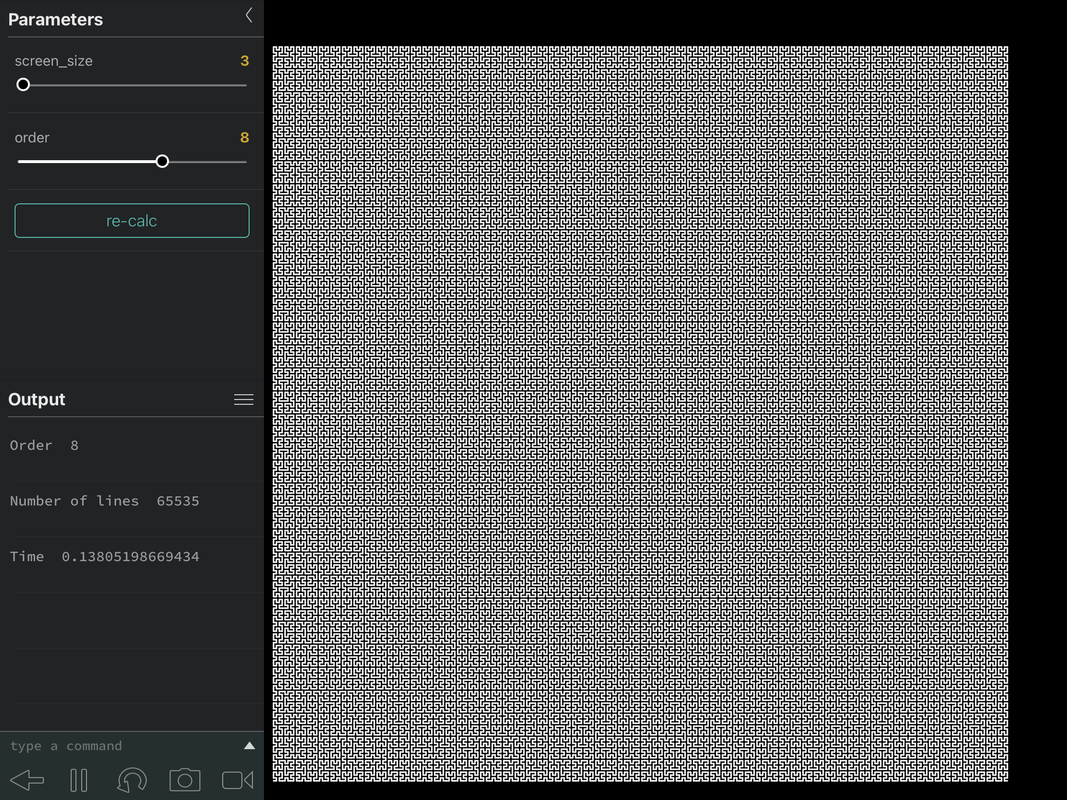
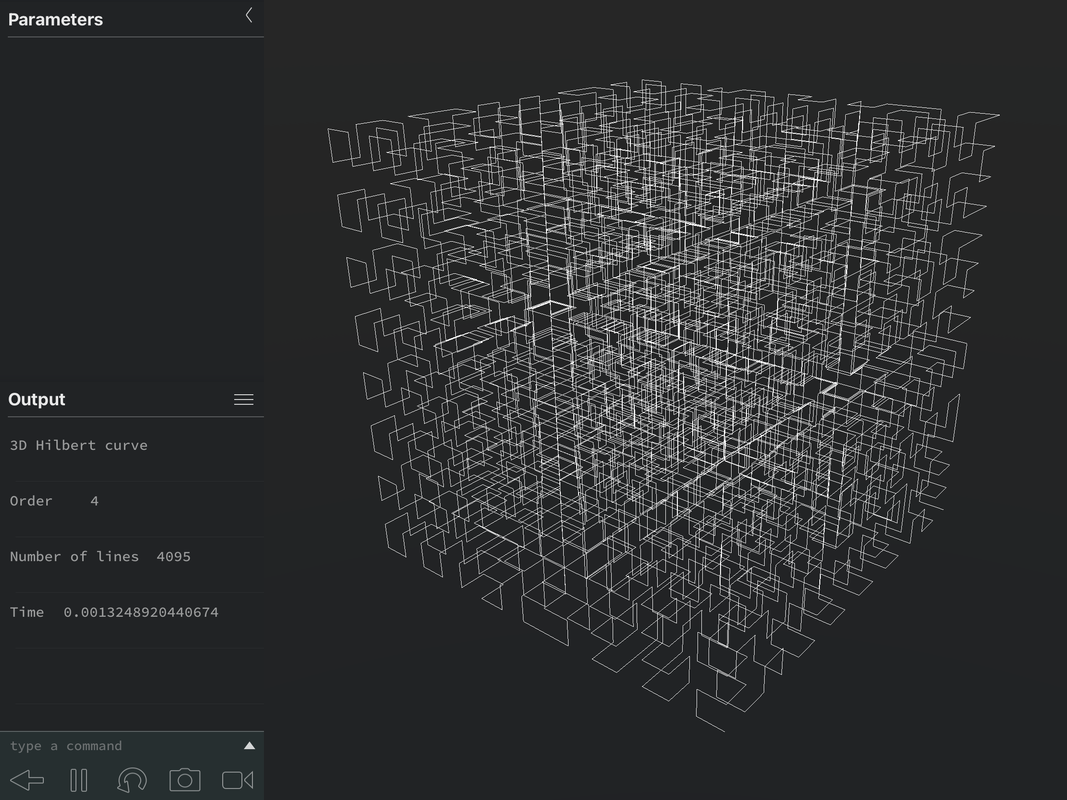
Here are some curves


Note: It graphs the curves "upside down" because the Y axis is inverted from a normal cartesian plane (Y=0 is the top and Y=240 is the bottom)
This could be easily fixed by adding "240-" before the Y coordinates in the Line() command.
This post gives off Barnsley's Fern vibes
Here is the code
Code:
ClrDraw:AxesOff:FnOff


0->Xmin:320->Xmax:0->Ymin:240->Ymax


BackgroundOn Black


Input "ORDER:",O


.5^OAns->Q


.5(Ans+Ans[i]->Z


Ans->R


{0,[i],1+[i],1->L2


For(I,1,4^O-1


   I->M


   remainder(Ans,4->L


   L2(1+Ans->V


   For(J,1,O-1


      int(M.25->M


      remainder(Ans,4->L


      If not(Ans


      Then


         [i]conj(V->V


      Else


         2^J


         If L=1


         Then


            V+Ans[i]->V


         Else


            If L=2


            Then


               V+Ans+Ans[i]->V


            Else


               [i]Ans-[i]+2Ans-1-[i]conj(V->V


            End


         End


      End


   End


   QAns+R


   Line(real(Z),imag(Z),real(Ans),imag(Ans),1,White,1


   Ans->Z


End
EDIT: Incorporated some of the optimizations from other users.
(The inner loops are optimized for speed rather than size since they can be called thousands of times)
Here are some curves
Note: It graphs the curves "upside down" because the Y axis is inverted from a normal cartesian plane (Y=0 is the top and Y=240 is the bottom)
This could be easily fixed by adding "240-" before the Y coordinates in the Line() command.
This post gives off Barnsley's Fern vibes


")
")


")