Hi,
I would like to know if anyone has tried to read and write files from the Calculator.
Many thanks in advance
Juan Antonio
Well, from a quick test I just did, it errors when trying to use the
open function:
Code: OSError: [Errno 30]
Which corresponds to a "Read-only file system" error, which makes sense.
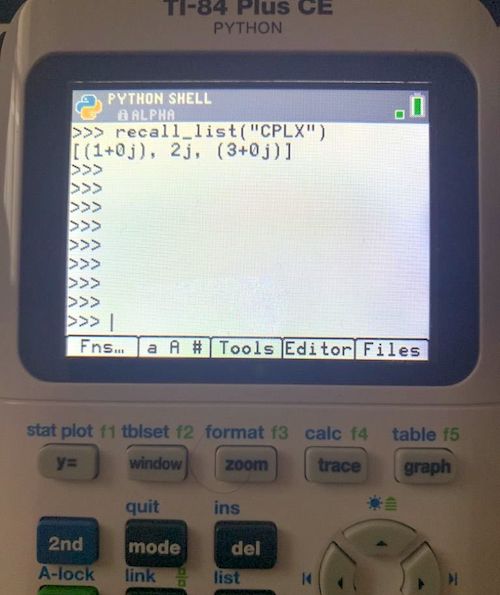
You can however read/write lists from the calc's variables via ti_system's recall_list and store_list functions. The default L1 to L6 lists but also custom-named ones.
Edit: it even works with complex lists, which is pretty cool:
Hi Adrian,
Many thanks for the alternative.
I am thinking to upload a txt file to the calculator to read it. For that escenario, do you think that is possible to use Micropython?
Well, that doesn't seem like a good usecase for Python, no. And may even be something TI doesn't want people to do (hence the lack of proper file support?).
TI-Basic programs are basically text though, so that's another option...
Oki,
Following your approach: “lists from the calc”
Is it possible to create that list in my computer and later import in the calculator to use in a program?
In that way, I could use the functions: recall_list and store_list
With data loaded from the computer to the calculator
Hi Adrian,
I found this video which show how to do it:
https://youtu.be/izNJuzNFyp8
I will try tomorrow
Cheers
Hi Adrian,
I was able to import data from a CSV file into the internal variable L1.
When I execute this simple program:
Code:
from ti_system import *


recall_list("L1")
I receive an error about "The variable doesn´t exist"
but if I type L1 in the calculator i see the values. What is missing?
L1 is stored in RAM in the same way that the Python script.
Many thanks in advance
Juan Antonio
Many thanks
 Code:
Code:
import ti_system as system


import ti_plotlib as plt


I = system.recall_list("1")


U = system.recall_list("2")


plt.cls()


plt.auto_window(I, U)


plt.title("Demo")


plt.pen("thin", "solid")


plt.axes("on")


plt.color (0, 0, 255)


plt.labels("I" ,"U" ,11 , 2)


plt.scatter(I, U, "x")


plt.color (255, 0, 0)


plt.pen("thin", "dash")


plt.lin_reg(I, U, "center", 2)


plt.show_plot()
Adriweb wrote:
Well, that doesn't seem like a good usecase for Python, no. And may even be something TI doesn't want people to do (hence the lack of proper file support?).
TI-Basic programs are basically text though, so that's another option...
How would I do this?
Register to Join the Conversation
Have your own thoughts to add to this or any other topic? Want to ask a question, offer a suggestion, share your own programs and projects, upload a file to the file archives, get help with calculator and computer programming, or simply chat with like-minded coders and tech and calculator enthusiasts via the site-wide AJAX SAX widget? Registration for a free Cemetech account only takes a minute.
»
Go to Registration page
You cannot post new topics in this forum
You cannot reply to topics in this forum
You cannot edit your posts in this forum
You cannot delete your posts in this forum
You cannot vote in polls in this forum