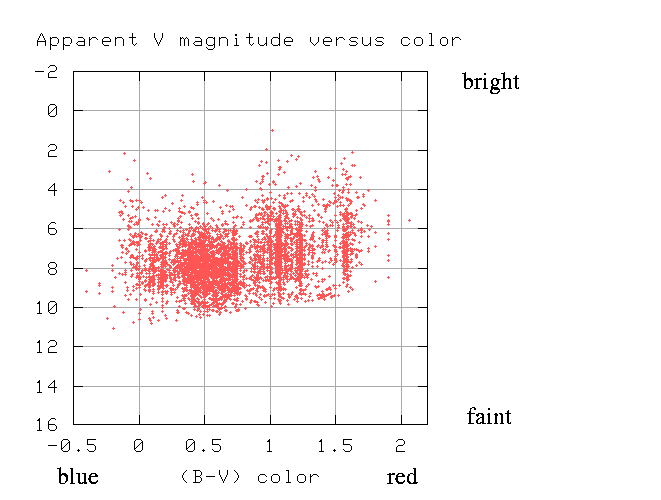
In astronomy, they often build graphs that relate the brightness or magnitude with time, distance or redshift. Negative values indicate the magnitude of bright stars, while positive values indicate low luminosity stars. For this reason, in order to obtain the correct magnitude of graphs, the y-axis values must be inverted. How can I create these charts with inverted y-axis with my TI84+CSE?
There is already a calculator option that does this?
How can I create the routines through Basic language?

Thank

Andrea Bertocco
Simply sticking a "-" sign in front of your function will have the same effect as inverting the Y axis Smile
Unless this is not quite what you are trying to do...
Thanks for the response, but it's not what I mean.
I try to explain myself better and I apologize for my bad English.

If I consider a set of datas (x=1,2,3,4,5,6 y=2,0.5,-1,-0.5,1,2), insert them in the tables L1, L2, and I build the graph, with my TI-84 C Plus Silver Edition, I get the following:

L1 L2

1 2
2 0,5
3 -1
4 -0,5
5 1
6 2

If we try to draw with this datas, the graph is wrong.

If the values that appear on the y-axis are values of magnitude or luminosity of a star or a Galaxy, these values must be reversed to obtain a correct graph.

How do I with my TI84 + CSE build this type of chart?
I hope I explain better
Thanks

Kind regards

Andrea Bertocco
You can reverse the y coordinates by running this piece of basic code before graphing it.
Code:
seq(L₂(X),X,dim(L₂),1,~1→L₂

This will make the last element become the first, the 2nd to last become the 2nd, and so on.
To switch the list back to the original coordinates, simply run the command again Smile
Thanks for the quick help, I am sure that the line of code you proposed works but because of some of my programming gaps, don't understand some
sequences of code:

1) I see the opening parenthesis on "seq(" but I can't find where is closed.
2) I don't understand what the symbol "~" and I don't know how you type with the calculator
3) I assume that the symbol "->" is reported by the command "STO"

If my request does not have a problem, would you be so kind as to give me the complete sequence to write the command line to her proposal?

Best regards and thanks for your willingness

Andrea Bertocco Smile
1) you don't need to close the parentheses because you have a STO
2) that's the negative sign. You can write it too as "-" but that can be confused with the minus sign
3) Yep, the STO button
As stated above, the ~ is the little negative sign at the bottom right beside the Enter key.
In basic, parentheses don't always need to be closed, one quick rule of thumb that I use is: don't put any parentheses at the end of a line or before a STO► (there is a single exception to this and it is in "For(" loops when the first thing after the For command is a lone If statement or the DS<( and IS>( commands in which case it is better to put the closing parenthesis even though it is not required)
Because you asked, here is the list of keys to press to enter the command:

Code:
[2nd]
[stat]
[right arrow]
[5]
[2nd]
[2]
[(]
[X,T,θ,n]
[)]
[Enter]
[X,T,θ,n]
[Enter]
[2nd]
[stat]
[right arrow]
[3]
[2nd]
[2]
[)]
[Enter]
[1]
[Enter]
[~]
[1]
[Enter]
[Enter]
[STO►]
[2nd]
[2]

This seems to prevent learning rather than promote it but we all had to start somewhere Smile
Okay to be fair, a list of keys to press is just insulting.
oldmud0 wrote:
Okay to be fair, a list of keys to press is just insulting.

he\she is the one who asked for it:
andrea.bertocco.1963 wrote:
If my request does not have a problem, would you be so kind as to give me the complete sequence to write the command line to her proposal?

And I kind of get it, if you don't know, you don't know, should not shame people for not knowing things, I think his questions are perfectly valid ones that I would expect if I asked someone like say my mother to type in the line...
Oh, I didn't read that. I guess I'm blind. Sorry.
I don't see how the list-reversing routine solves OP's problem. As far as I can tell, they want a graph (possibly scatterplot) where the y-coordinate increases downwards, where the coordinates are displayed with the graph, uninverted as usual. This is impossible in TI-BASIC, unless one writes a custom graph-displaying routine.

I suggest simply switching the x and y coordinate lists-- the x-coordinate can still only increase right, but it looks a little less off to have luminosity increase to the left.

It should be noted that converting astronomical magnitudes to luminosities isn't linear: the formula is luminosity = constant * 10^(-2.5*magnitude).
Hi

Thank you all for the help.
Already with your suggestions to my points 1) 2) and 3) I ran the code that still kindly "Mr. womp womp" she also transcribed totally key to fret, but unfortunately this does not execute the construction of the graph correctly.
From what I read in the post that we exchanged, "lirtosiast" has hit the problem.
This is not a list-inversion routine, is more complicated and impossible for the TI-BASIC.
As you can read in the post, "lirtosiast" presents a solution which, however, implies a knowledge of programming to which I am not prepared.
Patience! I'm keeping the graphs turned upside down!
Maybe, in the near future, someone will create a routine that does this and will share in the archive of downloadable software item archives/84pcse/basic/science/astronomy.
I assure you that amateurs astronomer could use them, there are several (at least here in Italy).

Thank you all!
Kind regards

Andrea Bertocco Smile
Okayyy, I get it now, you are trying to make a graph like this:

(creds to the educational website I found this on)
Where the Y axis is essentially flipped over. Indeed, this would be quite hard to replicate on your calc.
Perfect!

This particular graph relates the magnitude photometric V band with the B-V color index, but it's basically just what I need.
It doesn't matter if the x-axis represents the color index, the time, the redshift or any other units of measurement, the important thing is that the y axis (the magnitude of) must be essentially flipped.

Is it possible to do this? Very Happy

Andrea Bertocco
  
Register to Join the Conversation
Have your own thoughts to add to this or any other topic? Want to ask a question, offer a suggestion, share your own programs and projects, upload a file to the file archives, get help with calculator and computer programming, or simply chat with like-minded coders and tech and calculator enthusiasts via the site-wide AJAX SAX widget? Registration for a free Cemetech account only takes a minute.

» Go to Registration page
Page 1 of 1
» All times are UTC - 5 Hours
 
You cannot post new topics in this forum
You cannot reply to topics in this forum
You cannot edit your posts in this forum
You cannot delete your posts in this forum
You cannot vote in polls in this forum


Advertisement